
This past week Parcos took part in the Community & Technology conference of June 2021. We hosted a full day workshop as part of C&T, as well as a free mini workshop on Community Day.
Data Comics
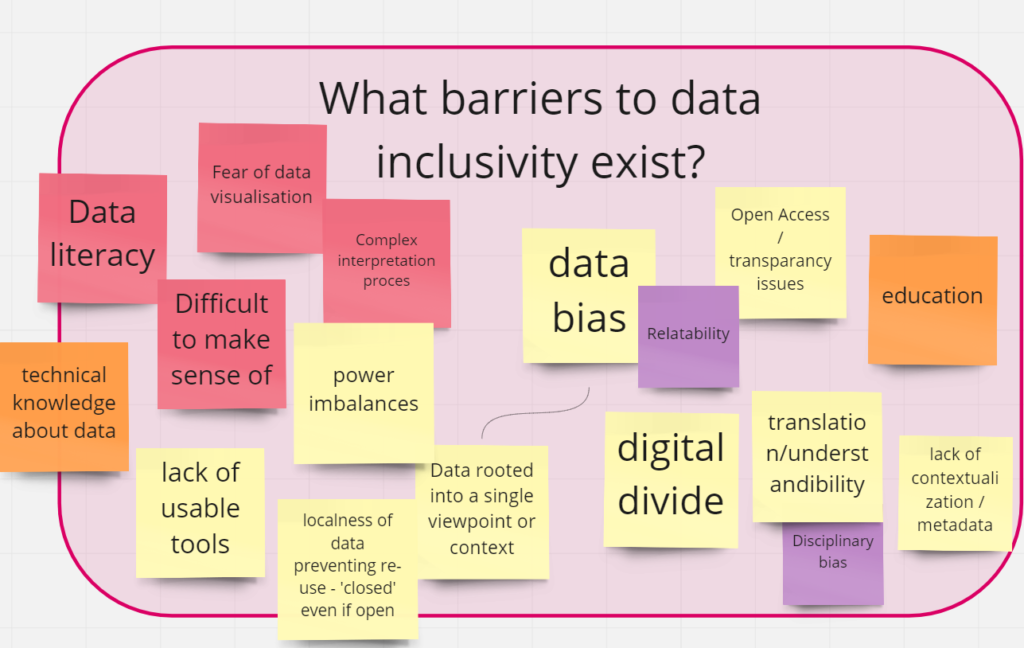
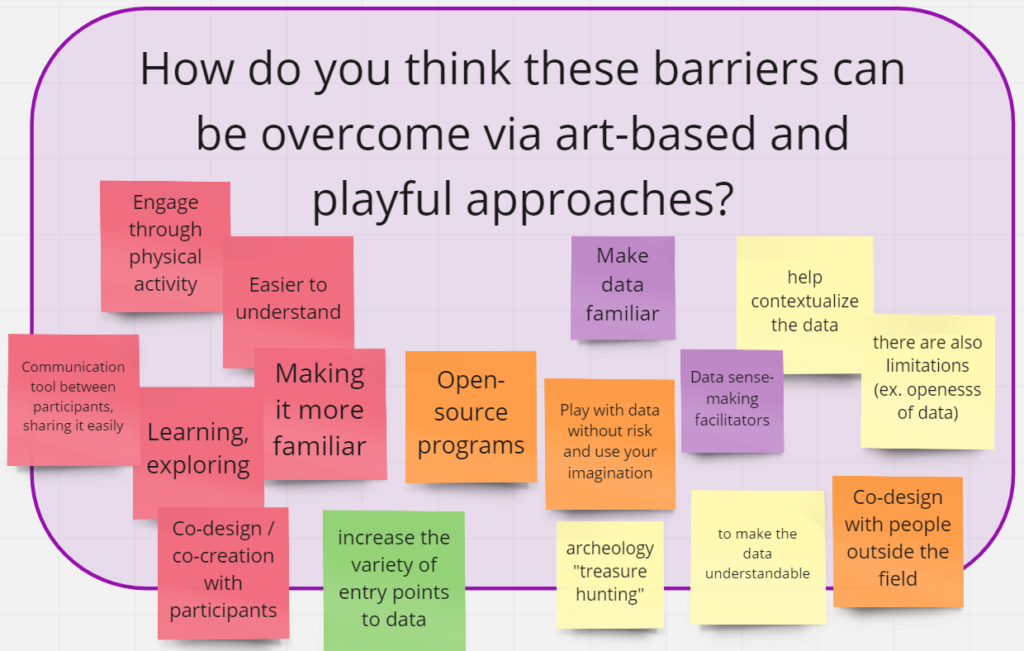
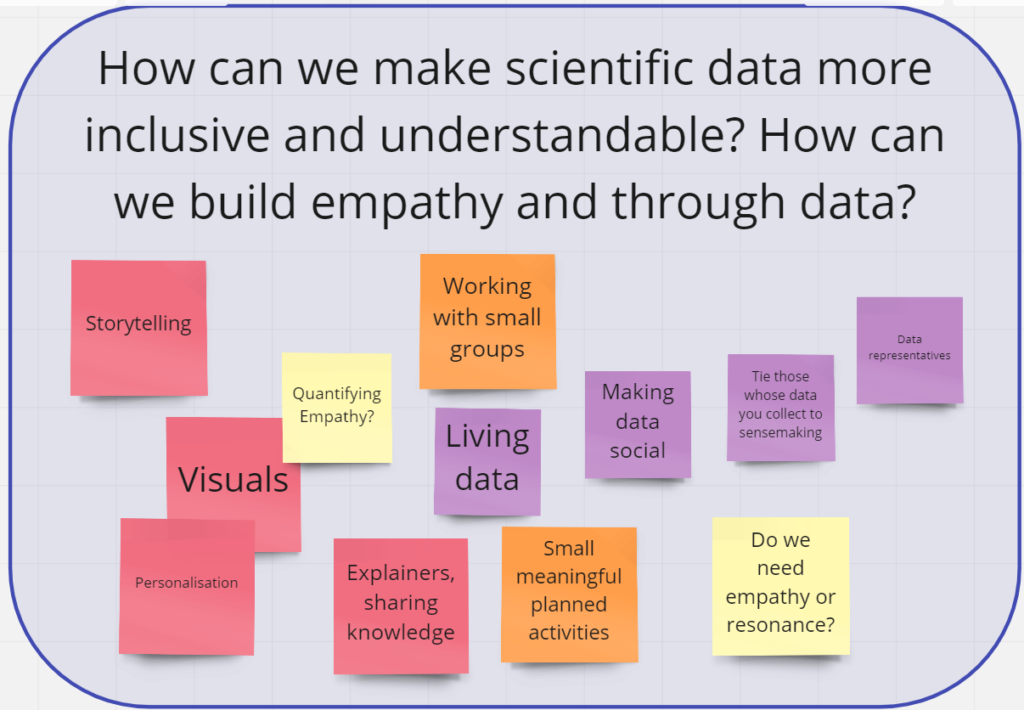
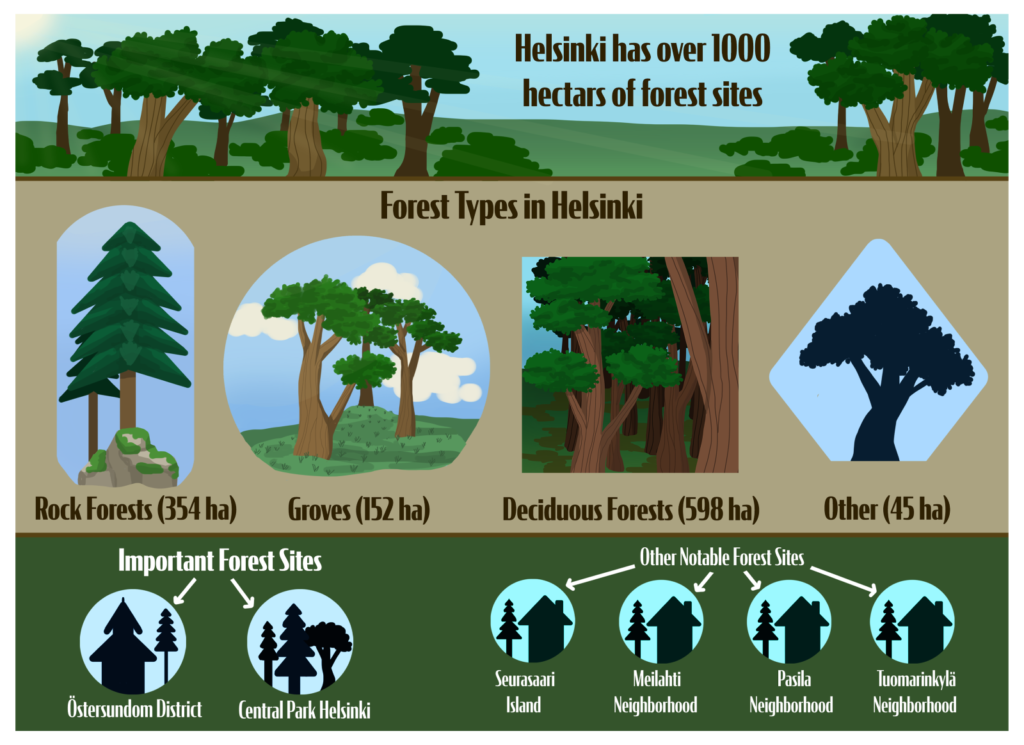
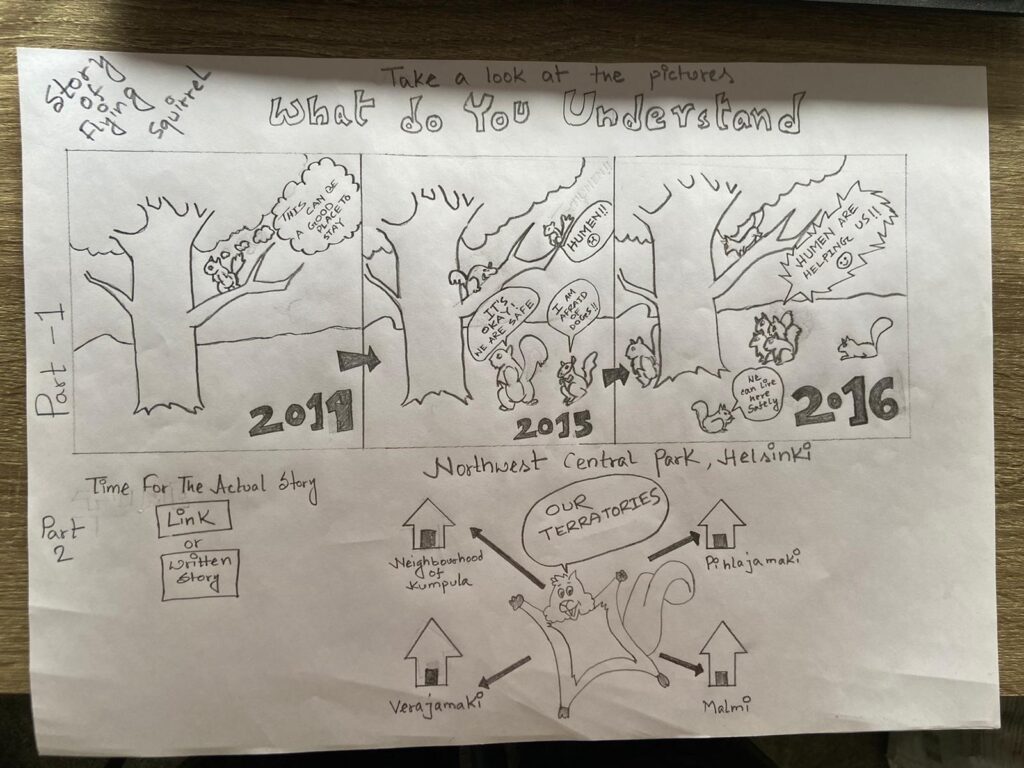
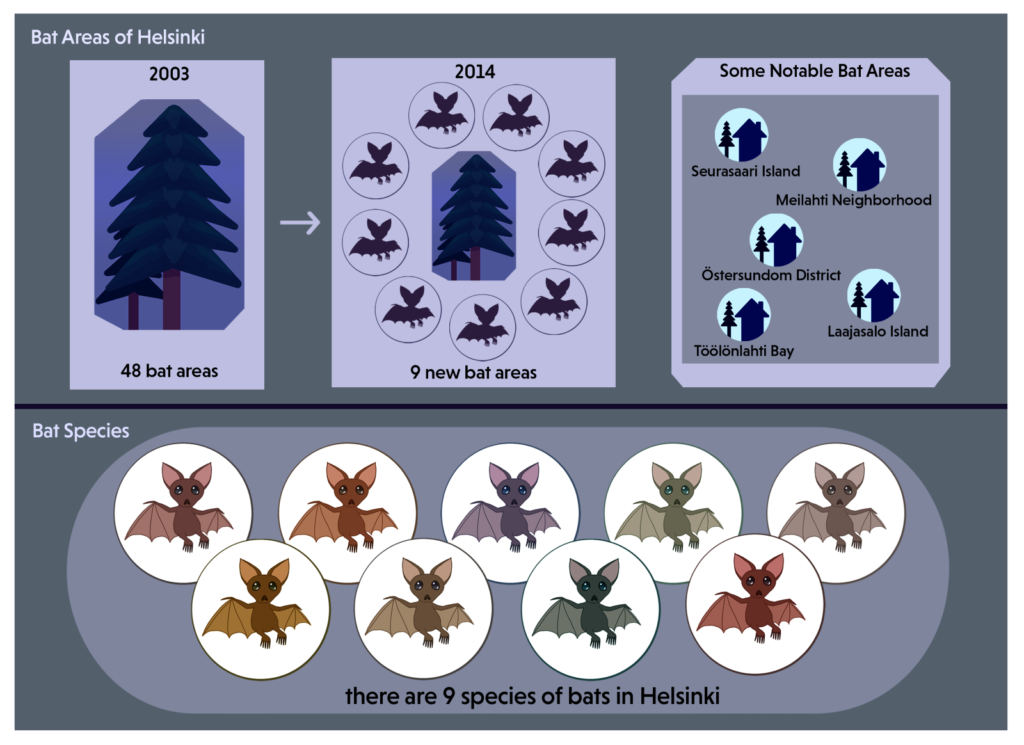
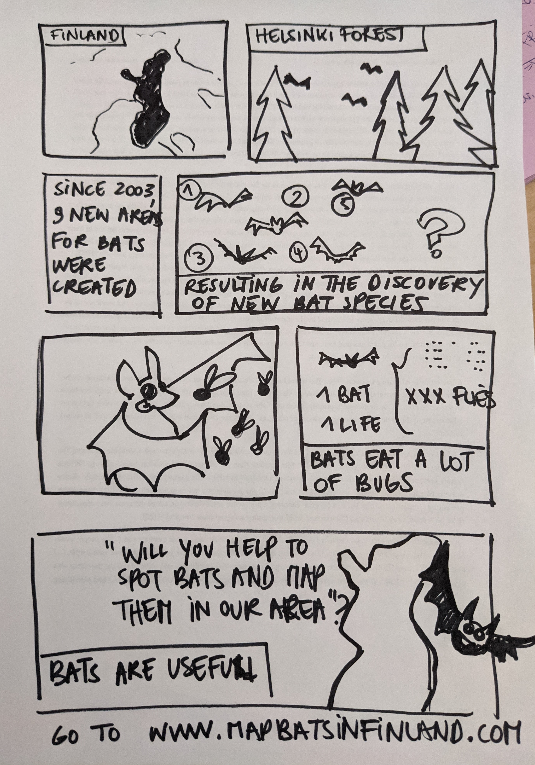
At both workshops we presented an activity based around the concept of data stories. The workshop participants were presented with a series of data comics or infographics, made and curated by our Parcos team. Then they were asked to make a data story about the information presented in the data comics/infographics, and to come up with their own interpretations about what the data may be telling us. The data was curated into comic format as a way to easily translate complicated information for a general audience.
The three data comics that were presented.
Data Stories
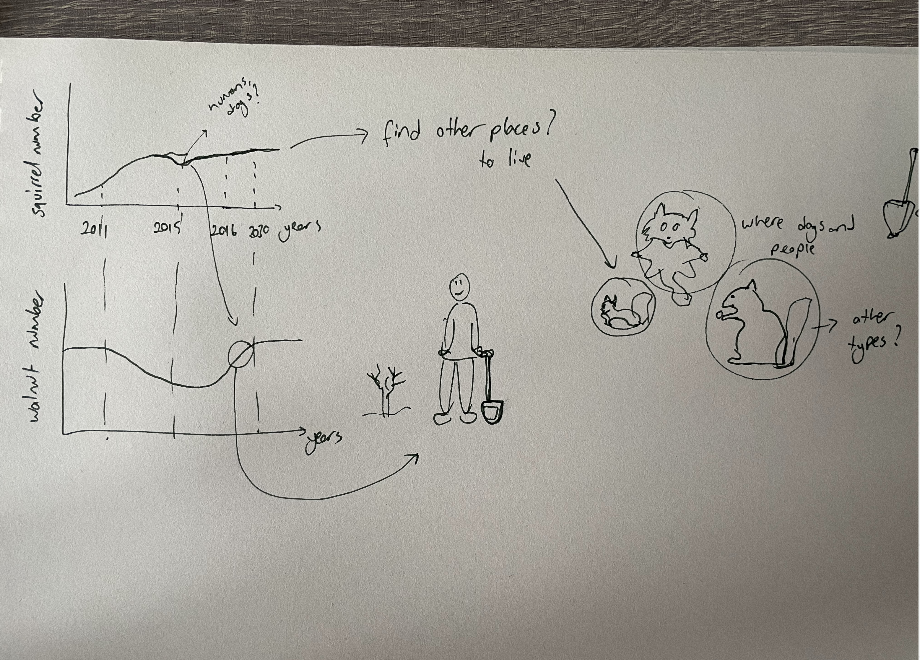
Data stories are a tool for science communication that allows the general public to participate in the process of research alongside researchers, and to share their own interpretations of data. Data stories are a great tool for community participation and data inclusion. The data stories made during our workshops were very open ended. We asked participants to come up with their own interpretations of what might be going on in the data comics, and then to communicate those interpretations through writing, drawing or whatever other creative means they might want to use.
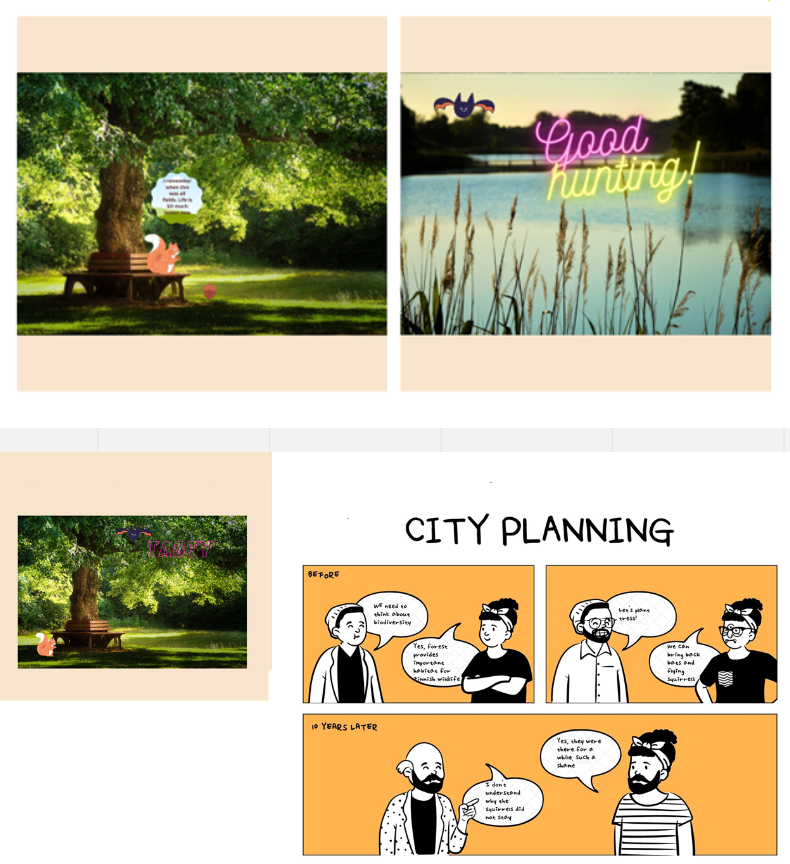
Just a few examples of the data stories that were made during the workshops.
We’re continuing the data inclusivity discussion on Discord! And you can join us at the link here!