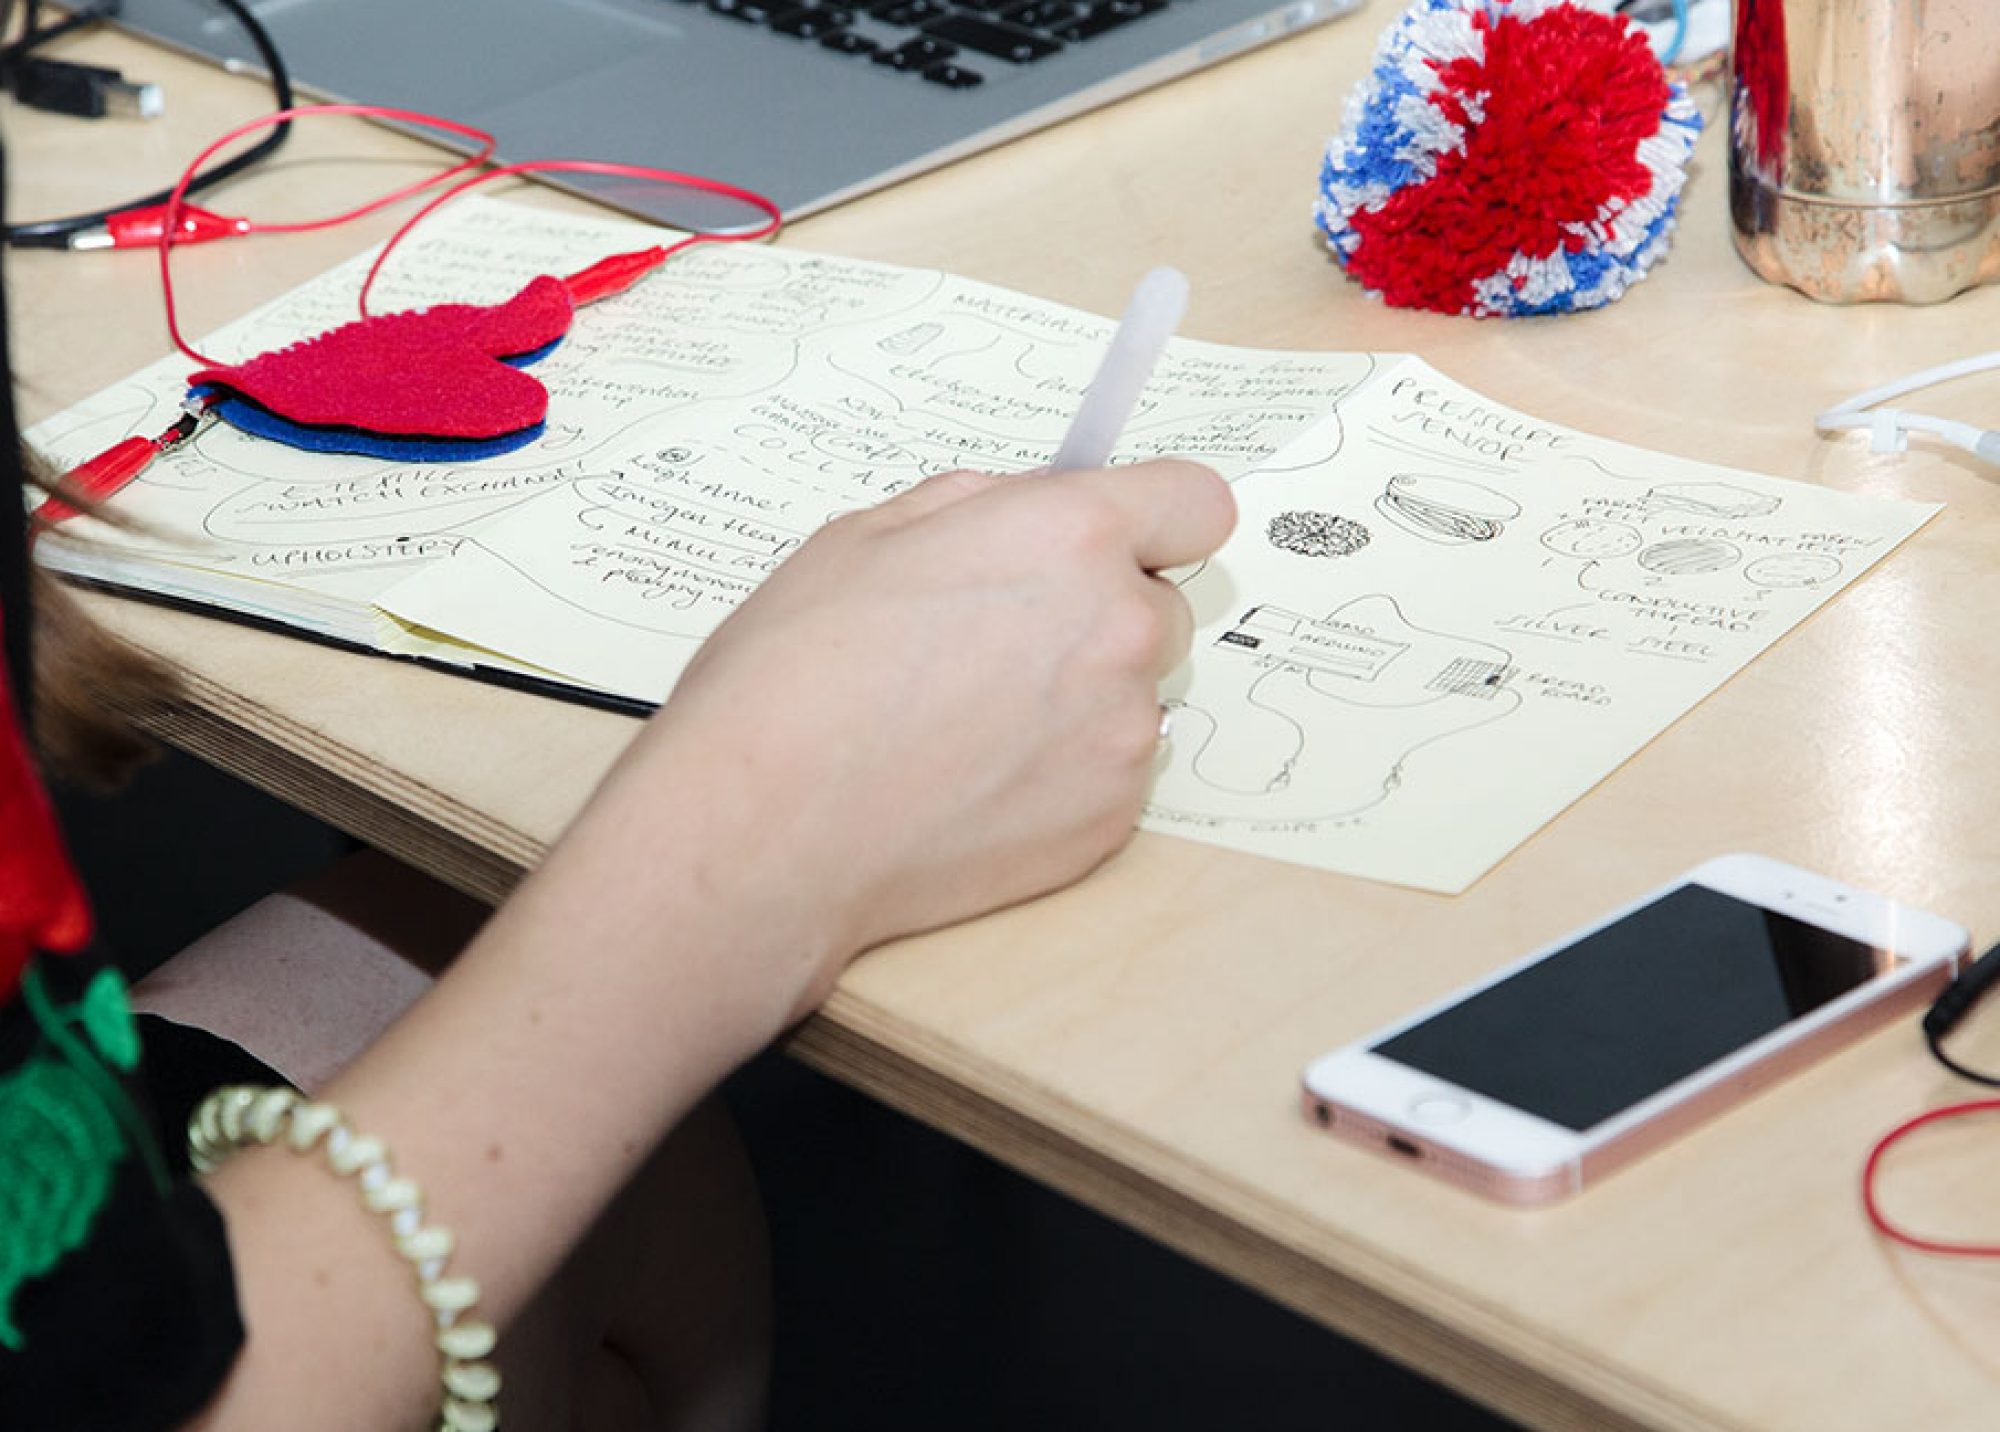
As part of the ParCos project VRT organised an inspiration session for young creatives and experienced media makers to think about new participatory ways of communicating science. On the 9th of May, 18 students of Media and Information Design from LUCA School of Arts visited the news department of VRT, the Flemish public broadcaster for a workshop with 6 creative media professionals. Together, they brainstormed about how current visual representations of science and data in a news context can be made more engaging.
Before the brainstorm session started, there was time to get familiar with each other’s work methods, challenges, and experiences. Everyone presented and clarified their previous work, and there was time to ask questions and engage in discussion. In addition, the ParCos project was presented, including the Storyteller, which inspired the audience to think of new ways to represent data.
The challenge
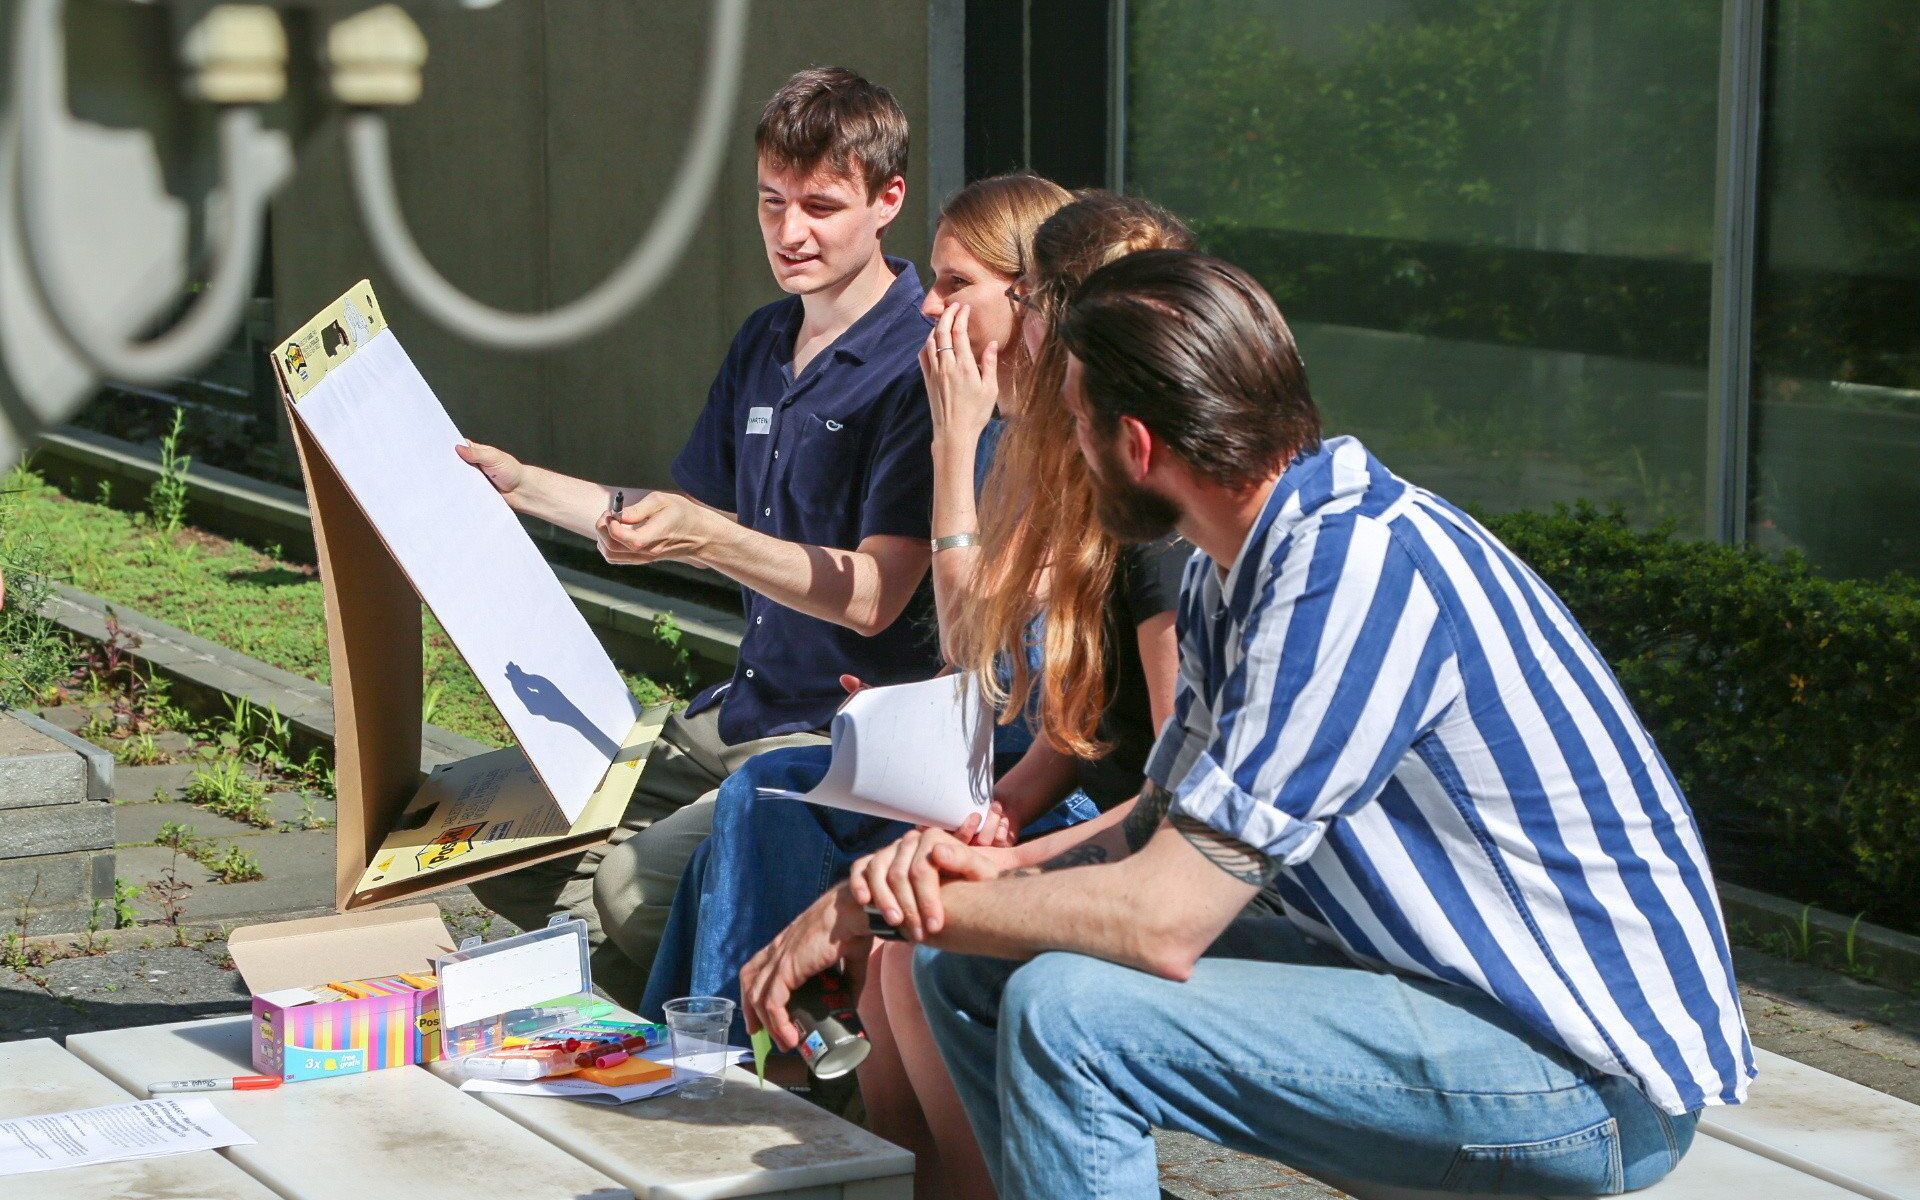
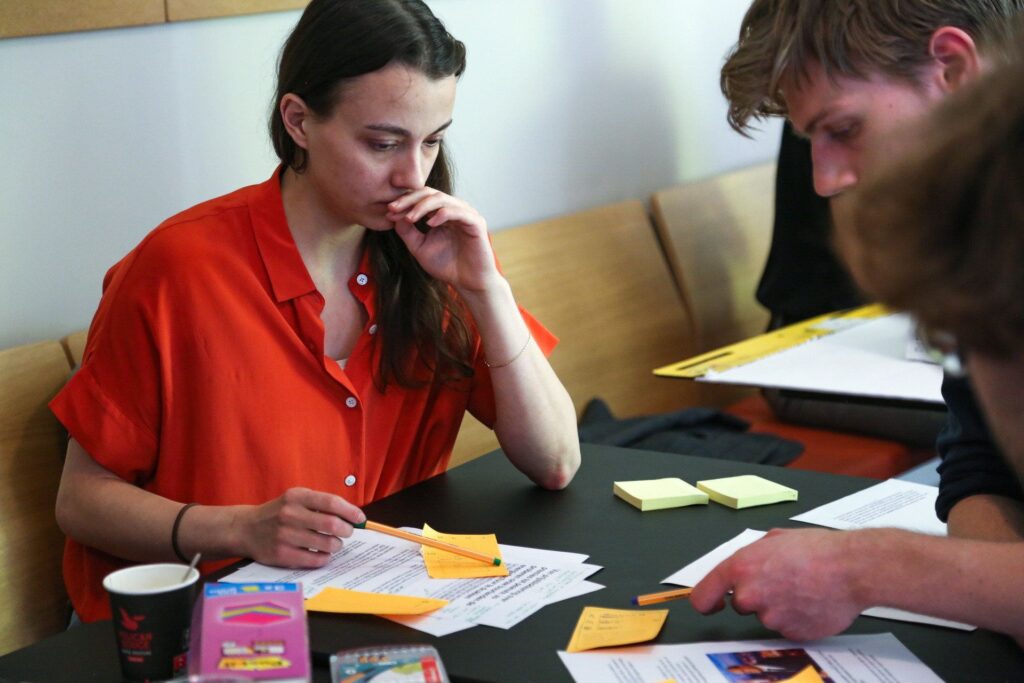
The participants of the workshop were challenged to redesign an article previously published on the website of VRT NWS in groups of 4 to 5 people. The combination of experience, expertise, and creativity resulted in interesting proposals and inspiring discussions.
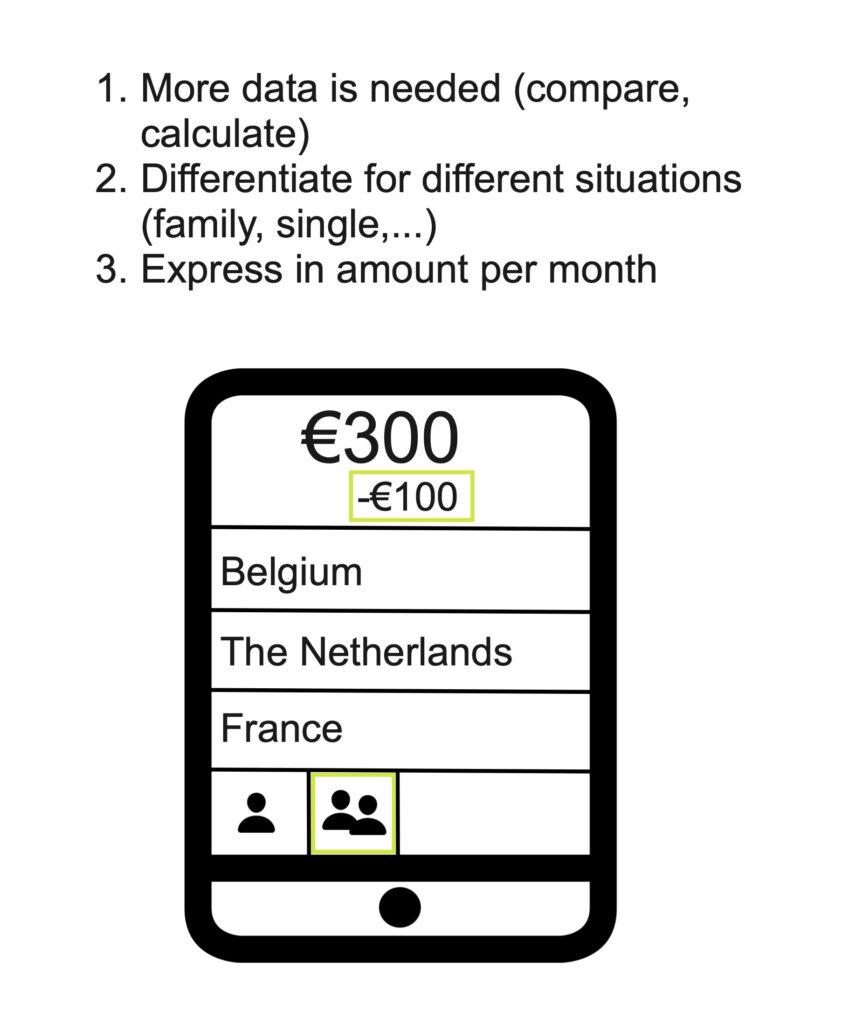
Group 1 – The energy calculator
The subject of the article of the first group was a comparison of how neighbouring countries are tackling the rising energy prices. Instead of complicated graphs, they designed a calculator to calculate the impact of different measures in the different countries for different situations (such as in a family context).
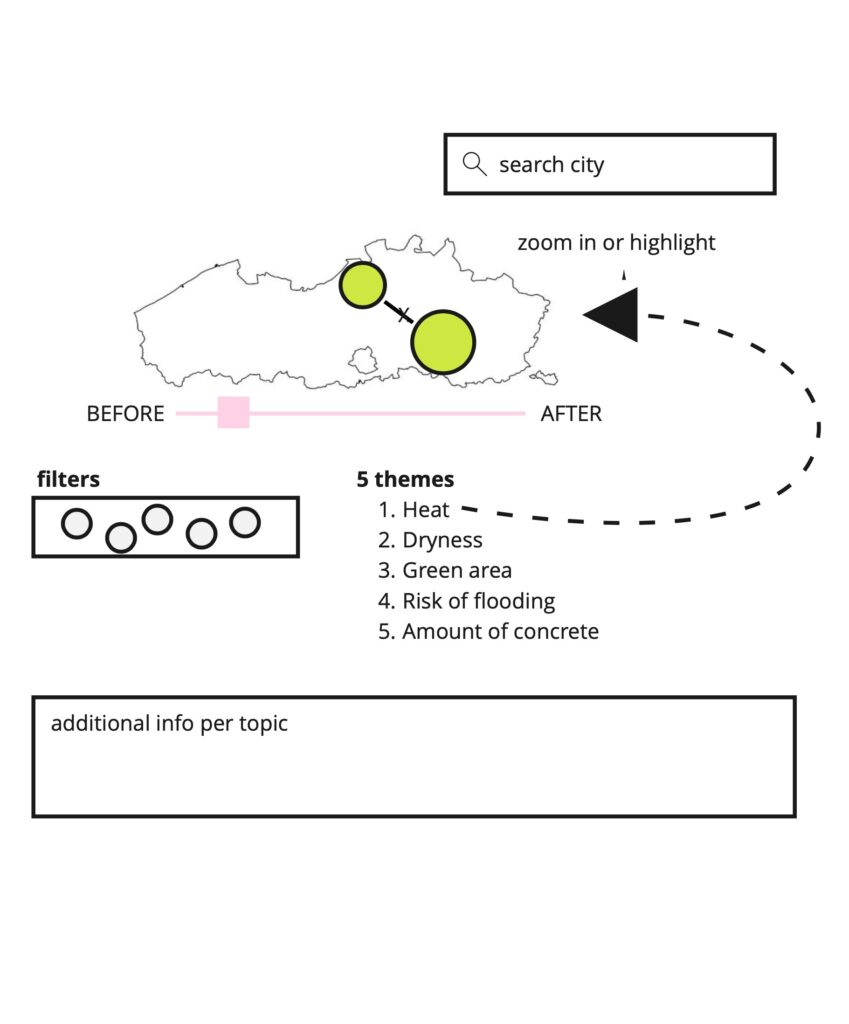
Group 2 – Interactive climate map
The second group worked on an article titled: “Where in Flanders will you feel the impact of climate change?” To visualise this, they made an interactive map, on which 5 different parameters (heat, danger of flooding, etc.) could be represented.
These topics were also further explained; you could zoom in on the situation and evolution in your own neighbourhood. This could then be supplemented with information or stories of citizens.
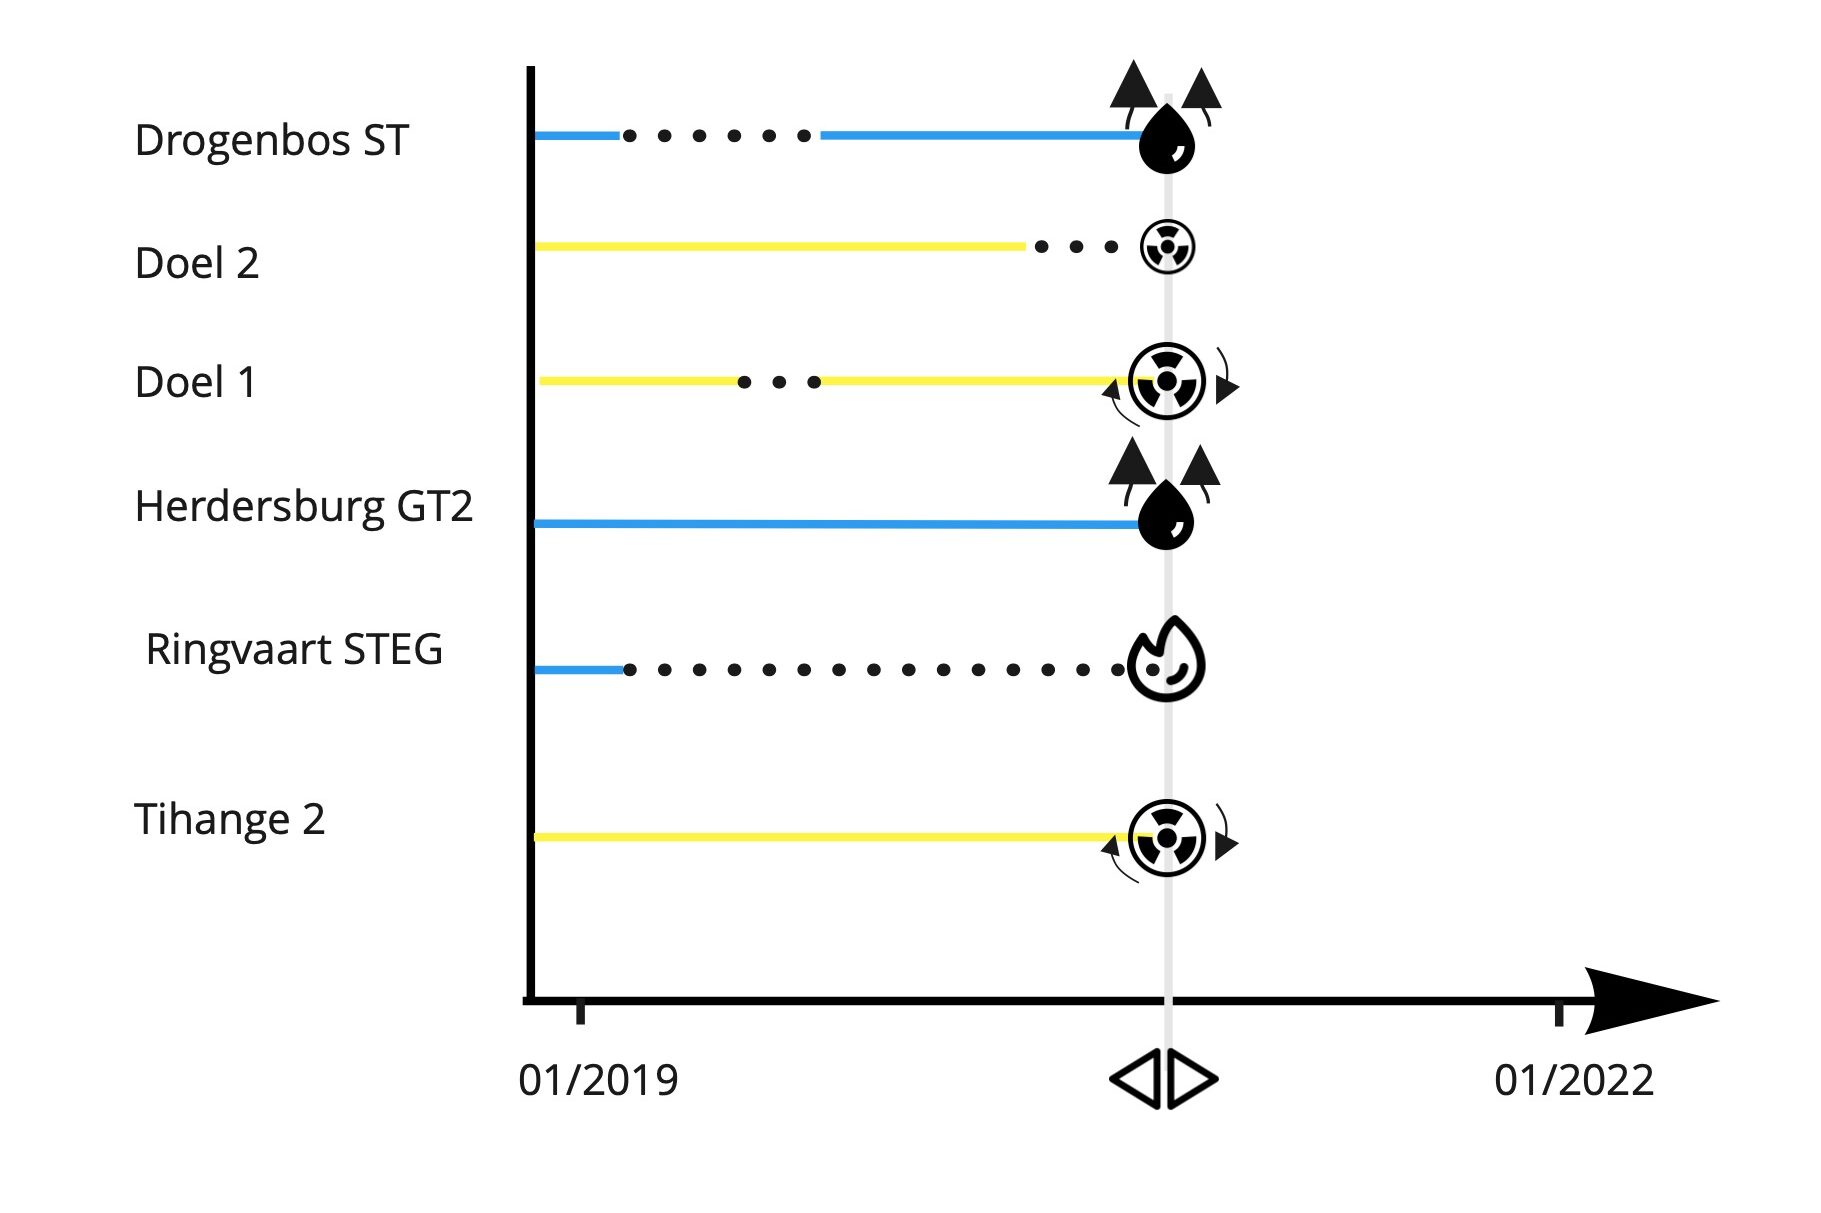
Group 3 – Comparison of different power plants
The third group made an interactive visualisation of the different power stations in Belgium, with an indication of when they were down. The conclusion from this was that gas-fired power stations fail more often than nuclear power stations.
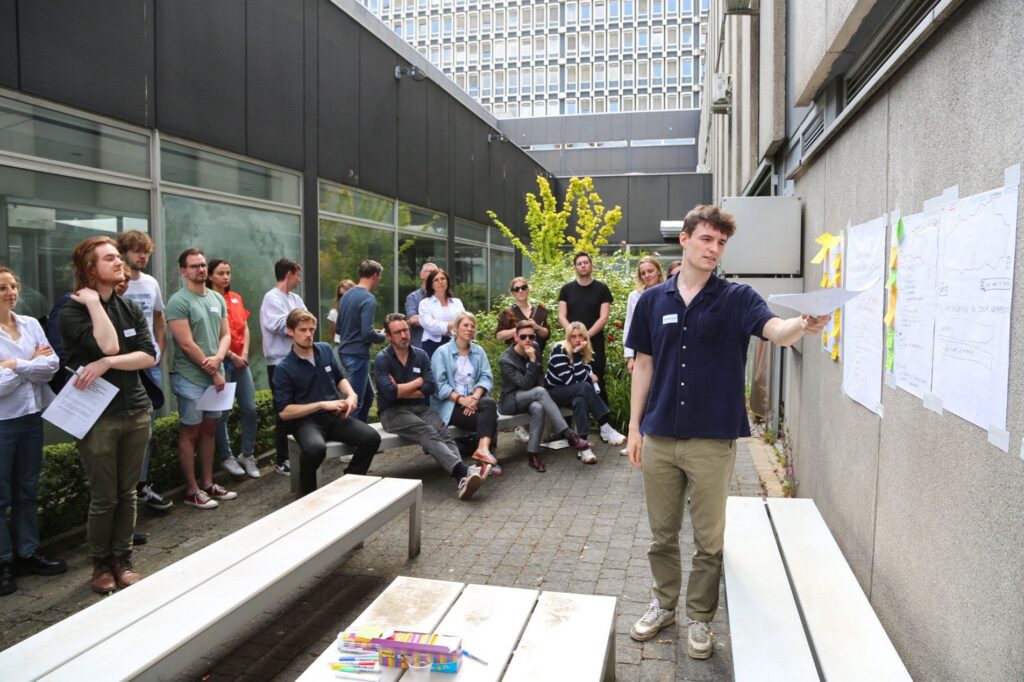
The results were presented to each other and to other news professionals, after which the students were able to take a look behind the scenes of VRT NWS with a tour. The results of the workshop will be used to improve and strengthen the Storyteller.